Since Earth’s geomagnetic field is not a perfect dipole, the inner Van Allen radiation belt gets closer to the Earth over the South Atlantic Ocean dipping down to an altitude of 200km. This peculiar area is called the South Atlantic Anomaly (SAA). It will leads to an increased flux of energetic particles in the region and exposes the orbiting satellites to higher-than-usual levels of radiation. Posing a potential danger to astronauts and man-made space assets traversing through it, this highly dense region attracts much attention in the present study.
Due to the secular variation of the geomagnetic field, the center of the SAA is known to drift both westward and northward in a low and gradual way. However, study shows that the westward drift rate of the SAA differs substantially, and the reason for such radical change in drift rate is still unclear. This limited understanding will result in certain deviation when deciding the distribution of the SAA in practical application.
Recently, a research group from the National Space Science Center (NSSC), the Chinese Academy of Science conducted a thorough study on the long-term variation of the trapped protons in the SAA region. By adopting data from 1980 through 2009 on board NOAA POES satellites, QIN Murong and ZHANG Xianguo from the Lab. of Space Environment Exploration, NSSC, analyzed the solar cycle variation of the proton flux in the SAA about three cycles (1980–2009).
Continuous and quantitative analysis was conducted to investigate the strength, location, and area of the SAA, as shown in figure 1. It shows that the longitudinal drift rate is highly correlated with the F10.7 and the correlation coefficient is 0.8777, as shown in figure 2; And besides the known northward drift, the southward drift of SAA is also found. The latitudinal drift rate of the SAA is approximately correlated with the F10.7 flux. Figure 3 shows that the correlation coefficient between them is 0.767. Further adopting IGRF and T96 model, the drift rate of the geomagnetic field minimum in the SAA is calculated under different solar wind dynamic pressure (Pdyn). The simulation result is highly consistent with the observation, demonstrating that the SAA drifts southward under high Pdyn and northward under low Pdyn. However, the Pdyn has little influence on the longitudinal drift of the SAA, which still requires further study.
According to the research group, the trapped radiation belt is not only a key region in the solar-terrestrial environment, but also an important part of the radiation environment. The result is of great importance to understanding the complex mechanisms of the dynamic radiation environment and building radiation belt model, both of which are of vital significance to scientific research and engineering application.The research entitled “Solar cycle variations of trapped proton flux in the inner radiation belt” was published on the Journal of Geophysical Research (JGR): Space Physics. Volume 119, DOI: 10.1002/2013JA019460.
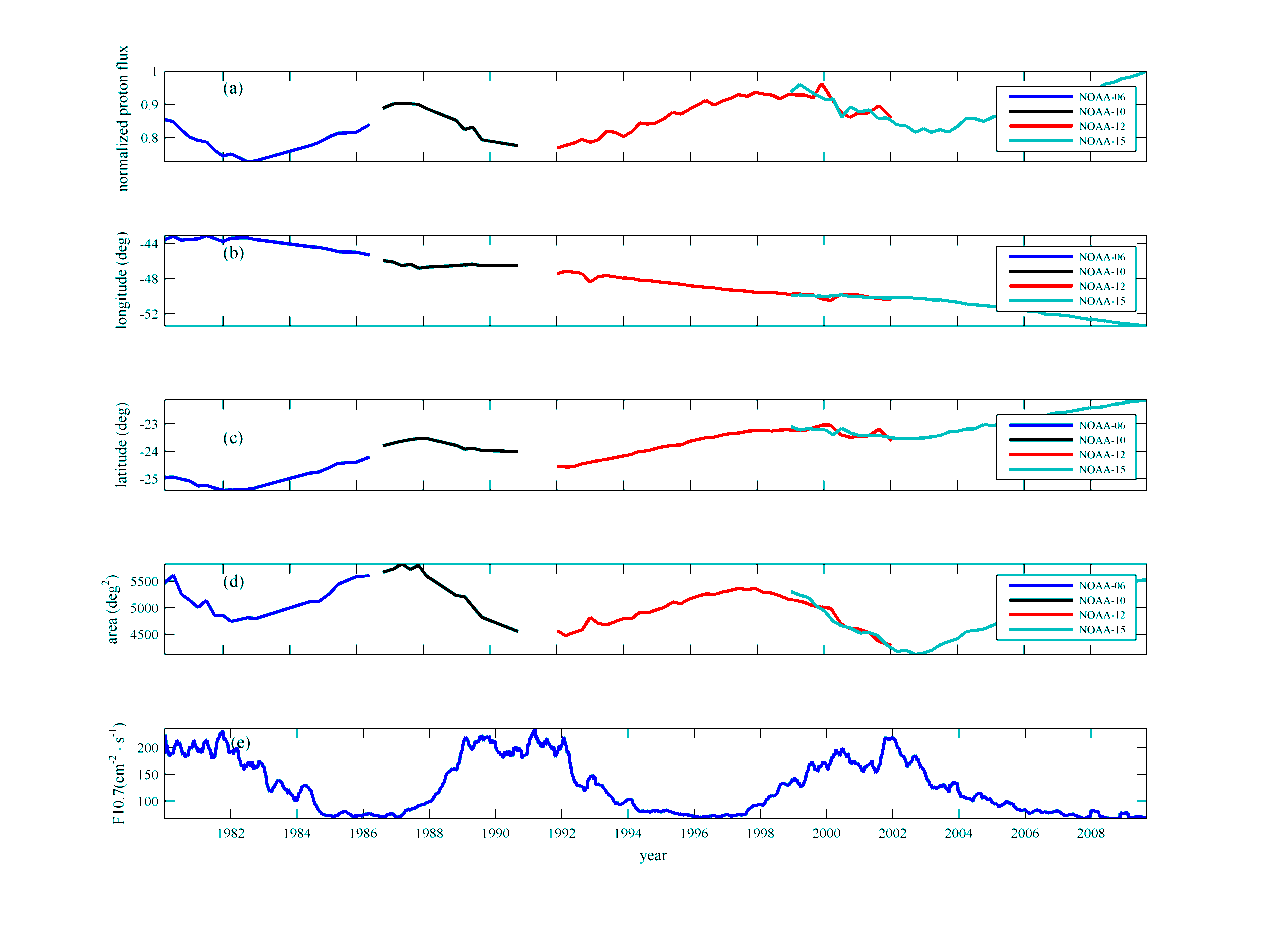
Figure 1. Temporal evolution of (a) the normalized peak proton flux, (b) longitudinal center, (c) latitudinal center and(d) the area of the SAA, and (e) F10.7. The blue, black, and red solid lines correspond to the data from NOAA 6, NOAA 10,NOAA 12, and NOAA 15 satellite, respectively. (Image by NSSC)

Figure 2. Secular variation of (top) the longitudinal position of the peakSAA proton flux and (middle) the eastward drift velocity of the SAA. (bottom) The westward drift rate and its linear fit as a function of theF10.7 flux. The dashed curves show the averaged F10.7 cm flux from 1999through 2009. (Image by NSSC)
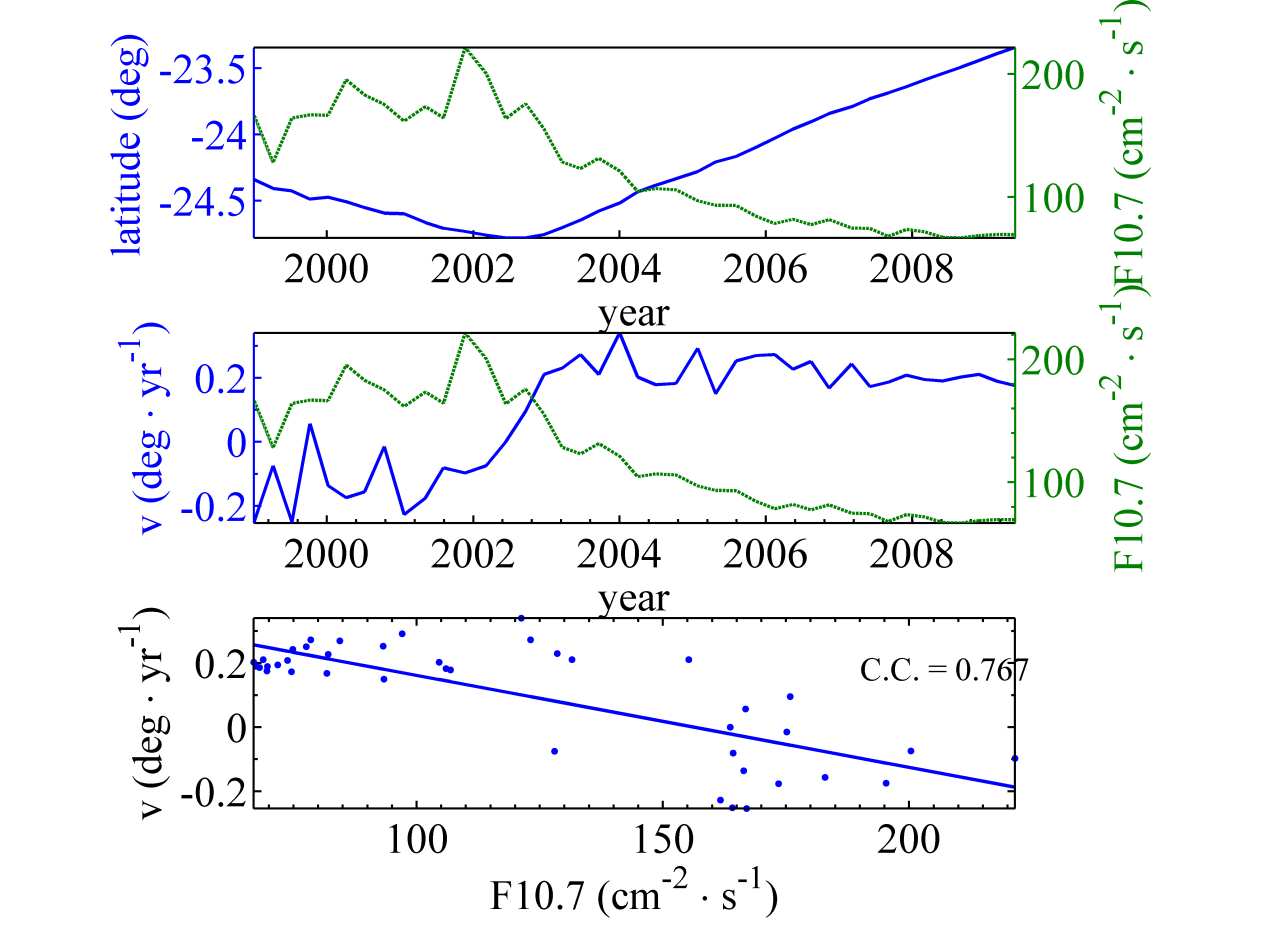
Figure 3. Secular variation of (top) the latitudinal position of the peakSAA proton flux and (middle) the northward drift velocity of the SAA. (bottom) The northward drift rate and its linear fit as a function of theF10.7 flux. The dashed curves show the averaged F10.7 cm flux from 1999through 2009. (Image by NSSC)